What’s the Best Data Warehouse Architecture for Reporting?
Most enterprises out there rely on a data warehouse as a single source of truth — a consolidated data repository that serves as a reporting layer for companies to identify trends and gain valuable business insights. However, to maximize performance and get the best out of a data warehouse, it’s essential to choose the right architecture and create a well-defined data model.
Learn More About Data Warehouse Architecture: Types, Components and Concepts
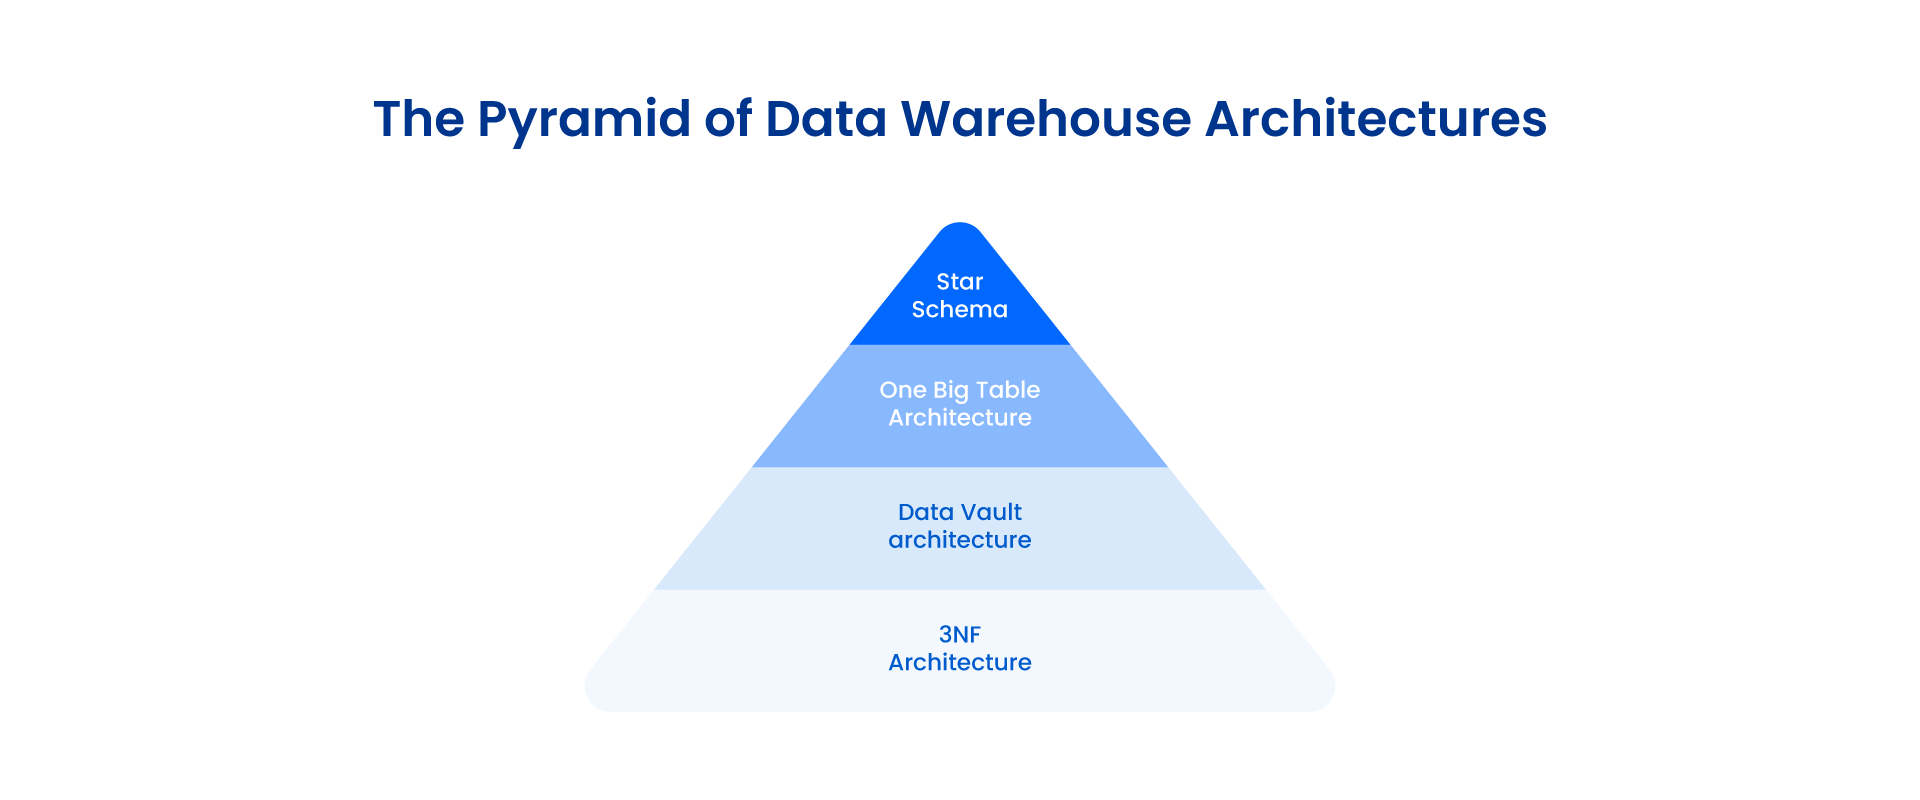
When we talk about data warehousing architectures, you have plenty of options, including 3NF, data vault, dimensional models (star and snowflake schema), and One Big Table (OBT). However, not all of these are suitable for reporting.
An important factor to take into consideration is the level of normalization/denormalization in the model. A highly normalized architecture is often difficult to consume, given the higher number of tables and relationships. The queries created for consumption are also very complex due to a large number of joins between the entities. Let’s glance at all these data warehousing architectures to identify which is the best reporting option.

3NF and Data Vault
Right off the bat, it’s evident that 3NF and Data Vault models are not suitable as reporting layers as these models are highly normalized. These architectures focus on reducing data redundancy, which naturally results in an increased number of tables. 3NF models are mostly used as an ODS (Operational Data Store) layer, which pulls data from multiple sources into a centralized repository.
Data Vault, on the other hand, is optimized for scalability and adaptability in terms of adding new data sources with reduced complexity. Kimball-style data marts are usually built on top of a data vault since using the vault directly for reporting is impractical due to the normalization factor. However, it can be used for auditing purposes.
Dimensional Models
Dimensional models are specifically designed to act as reporting layers. The denormalized structures of these models result in enhanced query performance and easier consumption. There are two types of schemas in dimensional models: star schema and snowflake schema. The main difference between these two is that a snowflake schema contains normalized dimensions, whereas a star schema contains denormalized dimensions.
Though Snowflake offers various advantages, including reduced data redundancy and easier navigation, a star schema is the clear winner when talking strictly about consumption for reporting. It’s simply because the latter contains denormalized dimensions, which means the queries are less complicated.
Moreover, keeping track of historical data with slowly changing dimensions (SCDs) can be a hassle due to parent-child dependencies between dimensions in the Snowflake Schema. This problem is non-existent in a star schema.
OBT (One Big Table)
So far, we’ve established that the level of normalization/denormalization is the key to identifying whether an architecture is suitable for reporting. By that logic, star schema stands firm as the preferred option. However, OBT takes it a step further by providing the highest level of denormalization possible. It combines all the tables to create one big table containing all the data.
If denormalization is truly the secret to a solid reporting layer, the OBT architecture should be an obvious choice for BI experts. But is it really that simple?
Well, not really. Here’s what gives star schema the edge over OBT: star schemas are optimized to keep track of historical data, which is an indispensable requirement for analytics purposes. Moreover, they often contain reusable conformed dimensions, which are easily maintainable and scalable to support cross-business reporting and analysis.
Although OBT provides supreme performance when querying data, especially with a columnar database, the architecture does have some issues of its own. Since everything is packed into one table, the data redundancy is high, which makes the architecture difficult to maintain. Also, preserving historical data through SCDs, though not impossible, is a far more complex task.
Creating reports based on current data is easy when using OBT, but when it comes to historical reporting, things can get complicated, which can be a dealbreaker for many BI experts.
Conclusion
Based on the analysis above, It’s safe to conclude that a star schema is, well and truly, the most suitable architecture for reporting. While other architectures have their own advantages, a star schema provides the perfect balance between the level of denormalization needed for less complex queries.
A star schema also offers structural benefits, such as historical data management and ease of use, making it stand out among the rest of the architectures. Building a star schema from scratch using an OLTP system as a starting point can be challenging and time-consuming. Thankfully, Astera DWB Builder provides the ideal solution to this problem.
Astera DW Builder has a built-in data model designer, a click-and-point interface, and the ability to normalize or denormalize entities without writing code. Using the intuitive designer, you can add new tables/fields and modify existing structures with just a few drag-and-drop.
On top of that, the dimensional model automation feature allows you to create a star schema directly from an existing architecture with just a few clicks. Creating and using star schemas for reporting has never been easier!
If you want to explore the agile way to build your data warehouse, reach us at sales@astera.com today.
Learn More About Dimensional Modeling: Overview, Benefits and Designing Tips
 Astera AI Agent Builder - First Look Coming Soon!
